Salto La Avispa
- 2,307 ft
- elevation
- Instituto Nacional de Parques
- managed by
- Feb–Mar
- best months
Salto La Avispa is a waterfall in Bolívar State, Venezuela, at about 2,310 ft above sea level. It is inside Parque Nacional Canaima. The nearest town is Kamarata, about 5.7 miles west of the falls. Salto Akareupa is within about 3 miles. Temperatures barely change through the year: highs run about 79°F (26°C) to 82°F (28°C) and lows about 65°F (18°C) to 67°F (19°C). Precipitation falls on about 26 days in June, the wettest month, and about 10 days in February, the driest. These typical figures for 1981–2010 come from the CHELSA 1 km climate model and CRU TS 4.09. The location and elevation come from OpenStreetMap and the Copernicus 90 m elevation model. Check local access rules and conditions before you go.
Conditions and forecast
Daily highs and lows, wind and the chance of precipitation at Salto La Avispa for the next 7 days, from the Open-Meteo model.
- Elevation
- 2,307 ft
- Land manager
- Instituto Nacional de Parques
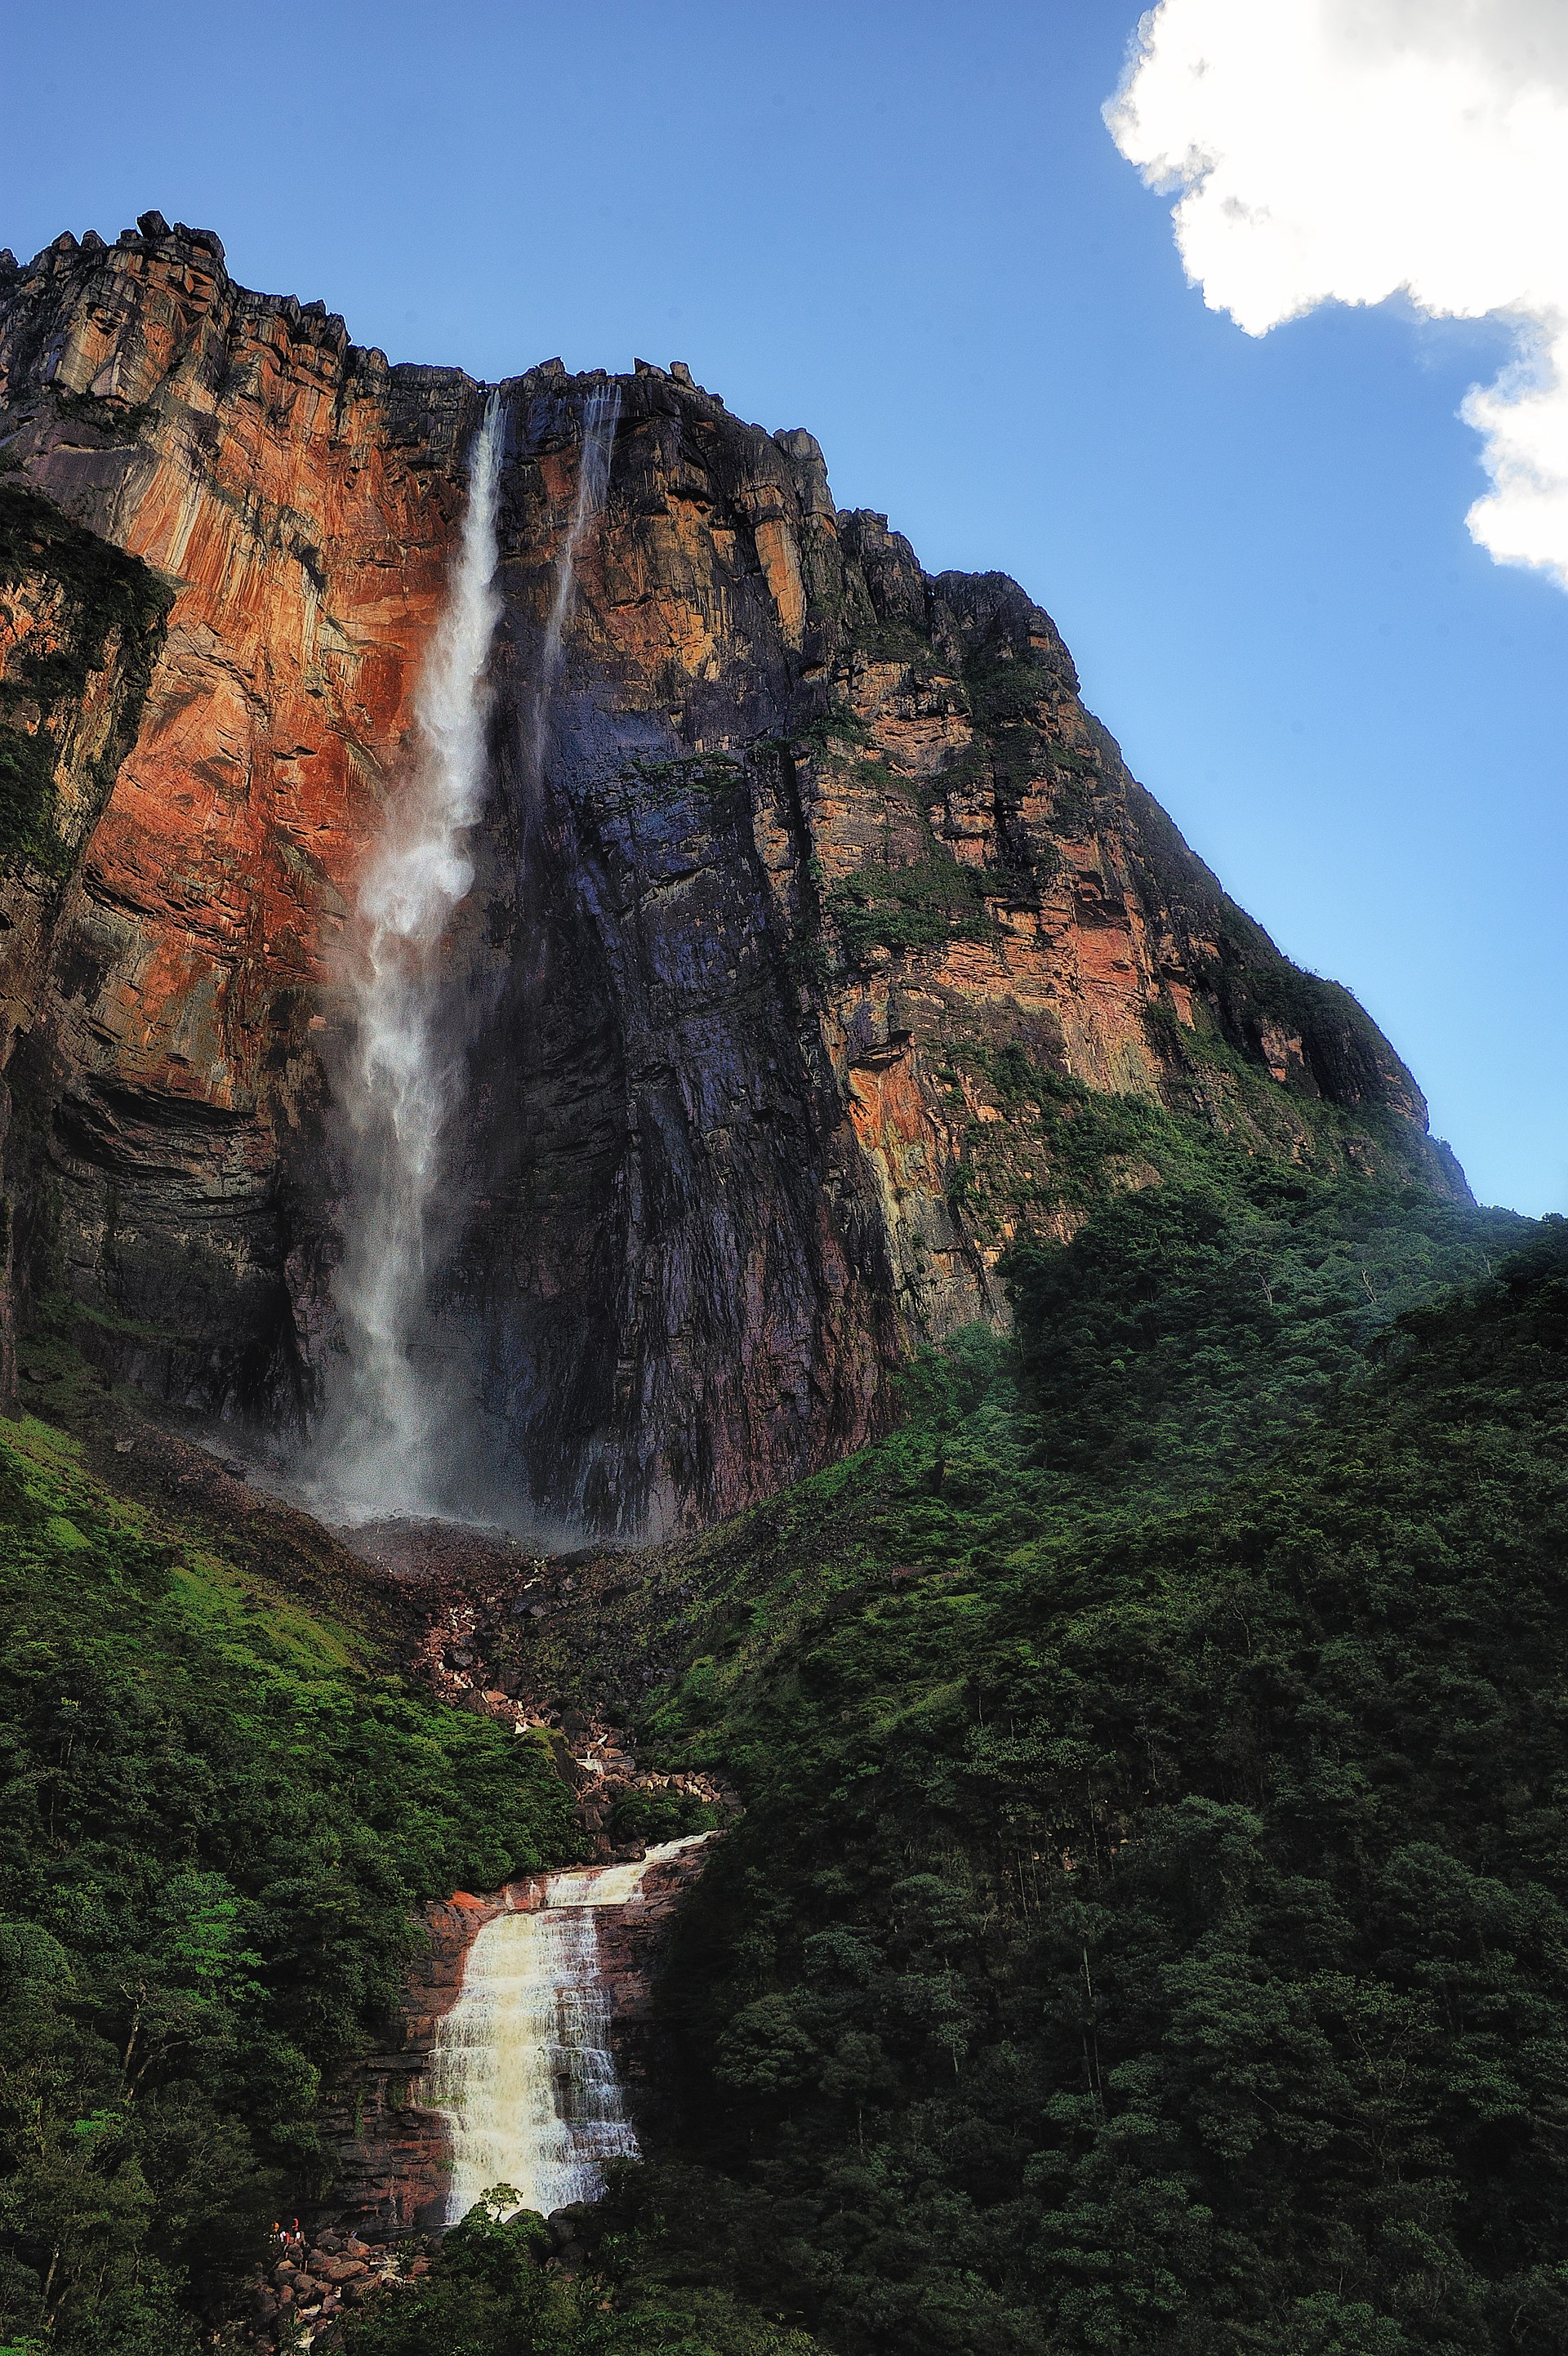 Salto ÁngelWaterfall · ~32 min drivePhoto: Paulo Capiotti, CC BY-SA 2.0 (via Wikimedia Commons)
 Salto KaruayWaterfall · ~1h 7m drivePhoto: Diego Pino Zanetti, CC BY-SA 3.0 (via Wikimedia Commons)
 Salto El SapoWaterfall · ~1h 20m drivePhoto: Stefan Freidel, CC BY 2.5 (via Wikimedia Commons)
- Salto AkareupaWaterfall · ~5 min drive
- Salto UruyénWaterfall · ~9 min drive
- Salto AichakWaterfall · ~16 min drive
- Salto KamadakWaterfall · ~21 min drive
- Salto Churún MerúWaterfall · ~23 min drive
- Salto ColibríWaterfall · ~25 min drive
- Salto La CortinaWaterfall · ~32 min drive
Best time to visit Salto La Avispa
Best months: February–March. Best months have typical highs of 55–85 °F, lows of 30 °F or warmer (32 °F where there's no snowfall data), at most one snowy day and no more than 12 wet days.
Jan
80° / 65°
13 wet
Feb
81° / 65°
10 wet
Mar
82° / 66°
11 wet
Apr
82° / 67°
13 wet
May
80° / 67°
22 wet
Jun
79° / 66°
26 wet
Jul
79° / 65°
26 wet
Aug
80° / 66°
23 wet
Sep
81° / 66°
16 wet
Oct
81° / 66°
13 wet
Nov
81° / 66°
13 wet
Dec
79° / 66°
15 wet
Typical high / low (°F) and days with rain or snow, 1981–2010. Modelled for the 1 km square this place sits in (average height 2,490 ft), not measured at a weather station. Snowfall days aren't in this data. Source: CHELSA 1 km climate model (1981–2010) and CRU TS 4.09 wet days. Data: CHELSA V2.1 climatologies (Karger et al. 2017), WSL (CC0 1.0); CRU TS 4.09 (Harris et al. 2020), University of East Anglia Climatic Research Unit. Contains public sector information licensed under the Open Government Licence v3.0. (Open Government Licence v3.0).

Map and trail data © OpenStreetMap contributors
