Clayton City Walking Trail
- 0.3 mi
- loop
- 43 ft
- climb
- 568 ft
- high point
- Loop
- route
- Oct–May
- best months
Clayton City Walking Trail is a short, easy loop in Clayton, Alabama, about 0.2 miles from the center of town. The trail is 0.31 miles long, and the whole route rises and falls by about 43 feet, making it a flat, low-effort walk that can be done in a few minutes. Spring and fall are the most comfortable times to go. Typical averages from a nearby weather station in Clayton show October highs around 78°F with lows near 55°F, and April is similar at about 76°F by day and 52°F at night. Midsummer highs typically reach the low 90s. For time on the water, Pea Creek is about 6.8 miles away and Barbour Creek about 8.8 miles away, both canoeing spots.
Source: Roamze catalog (indexable pages within 10 miles, PostGIS distance)
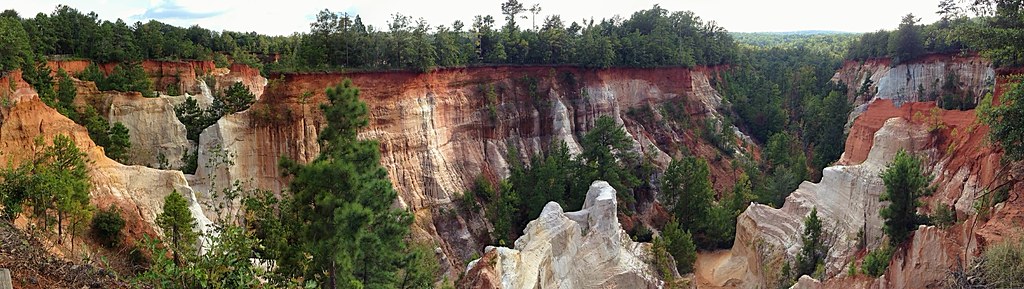 Canyon Loop TrailHiking · ~58 min drivePhoto: StephenGA, Public Domain Dedication (CC0) (via Flickr)
 Backcountry TrailHiking · ~58 min drivePhoto: StephenGA, Public Domain Dedication (CC0) (via Flickr)
- Bartram National Recreational TrailHiking · ~1h 11m drive
- BartramHiking · ~1h 13m drive
- CanyonsHiking · ~58 min drivePhoto: StephenGA, Public Domain Dedication (CC0) (via Flickr)
- Lumpkin TrailHiking · ~1h 14m drive
- BOLD DESTINY HORSE TRAILHiking · ~1h 13m drive
- Alligator Lake TrailHiking · ~18 min drive
- Pleasant Hill Mtn Bike TrailHiking · ~1h 13m drive
- Bottomland Cut-offHiking · ~19 min drive
Best time to visit Clayton City Walking Trail
Best months: October–May. Best months have typical highs of 55–85 °F, lows of 30 °F or warmer (32 °F where the station doesn't record snow), at most one snowy day and no more than 12 wet days.
Jan
58° / 37°
8 wet
Feb
63° / 40°
8 wet
Mar
70° / 46°
7 wet
Apr
76° / 52°
6 wet
May
84° / 61°
7 wet
Jun
89° / 69°
9 wet
Jul
91° / 71°
10 wet
Aug
90° / 71°
9 wet
Sep
86° / 66°
6 wet
Oct
78° / 55°
5 wet
Nov
68° / 45°
5 wet
Dec
60° / 40°
8 wet
Typical high / low (°F) and days with rain or snow, 1991–2020. Measured at Clayton, AL, 0.4 mi away at 569 ft. Source: NOAA NCEI U.S. Climate Normals 1991–2020.
Map and trail data © OpenStreetMap contributors
