Fall Down
- 35 ft
- elevation
Fall Down is a waterfall in County Cork, Ireland, at about 40 ft above sea level. The nearest town is Castletownshend, about 3.0 miles southwest of the falls. Peaks within about 3 miles include Beann a' tSídheáin, Carraig a' Rince and Cnoc Mór. For camping, Hideaway Camping & Caravan Park is within about 6 miles. The location and elevation come from OpenStreetMap and the Copernicus 90 m elevation model. Check local access rules and conditions before you go.
Conditions and forecast
Daily highs and lows, wind and the chance of precipitation at Fall Down for the next 7 days, from the Open-Meteo model.
- Elevation
- 35 ft
 Mullinhassig WaterfallWaterfall · ~59 min drivePhoto: Acediscovery, CC BY 4.0 (via Wikimedia Commons)
 Torc WaterfallWaterfall · ~1h 3m drivePhoto: Marathon, CC BY-SA 2.0 (via Wikimedia Commons)
 O'Sullivan's CascadeWaterfall · ~1h 9m drivePhoto: Keith Cunneen, CC BY-SA 2.0 (via Wikimedia Commons)
- Mare's Tail WaterfallWaterfall · ~46 min drive
- Dromanassig WaterfallWaterfall · ~47 min drive
- Gleninchaquin WaterfallWaterfall · ~48 min drive
Also worth it near here
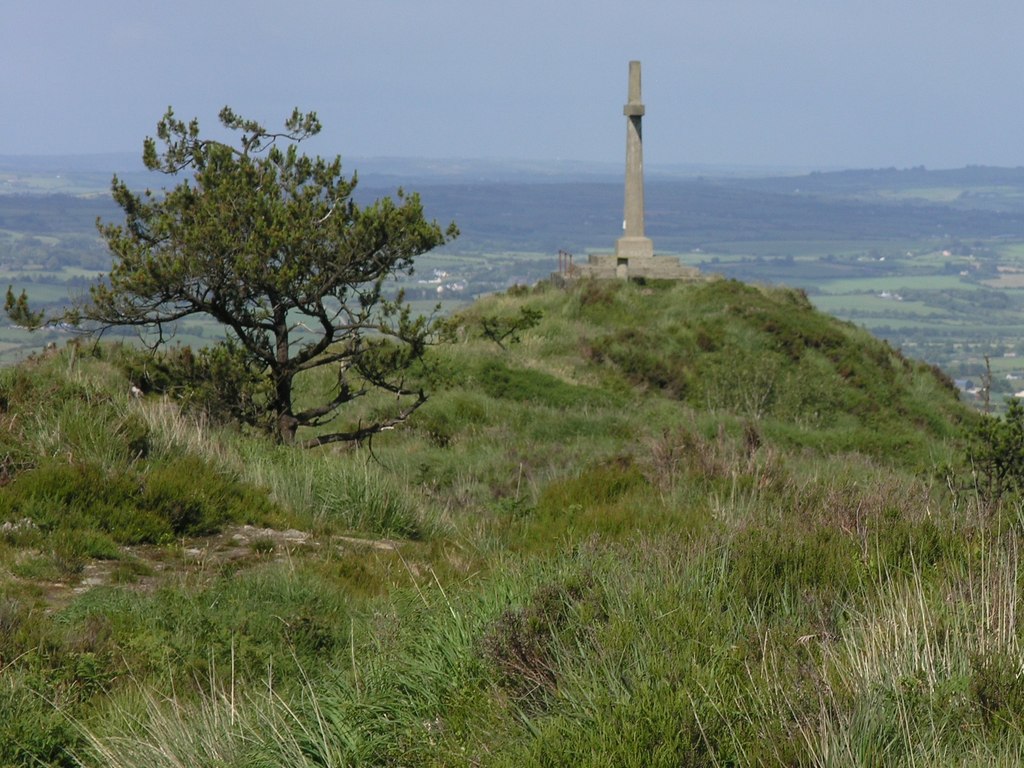 CarrigfaddaSummit · ~19 min drivePhoto: Hywel Williams, CC BY-SA 2.0 (via Wikimedia Commons)
 Dunbeacon Camping and GlampingCamping · ~28 min drivePhoto: Jonathan Billinger, CC BY-SA 2.0 (via Wikimedia Commons)
 Beara Way Lonehort LoopHiking · ~45 min drivePhoto: Colin Park, CC BY-SA 2.0 (via Wikimedia Commons)
Best time to visit Fall Down
No month here meets our mild-weather rule. Best months have typical highs of 55–85 °F, lows of 30 °F or warmer (32 °F where there's no snowfall data), at most one snowy day and no more than 12 wet days.
Jan
48° / 42°
22 wet
Feb
48° / 41°
18 wet
Mar
50° / 42°
19 wet
Apr
53° / 44°
17 wet
May
57° / 48°
16 wet
Jun
61° / 52°
14 wet
Jul
64° / 56°
16 wet
Aug
64° / 56°
17 wet
Sep
61° / 54°
17 wet
Oct
56° / 50°
21 wet
Nov
52° / 45°
21 wet
Dec
49° / 43°
22 wet
Typical high / low (°F) and days with rain or snow, 1981–2010. Modelled for the 1 km square this place sits in (average height 85 ft), not measured at a weather station. Snowfall days aren't in this data. Source: CHELSA 1 km climate model (1981–2010) and CRU TS 4.09 wet days. Data: CHELSA V2.1 climatologies (Karger et al. 2017), WSL (CC0 1.0); CRU TS 4.09 (Harris et al. 2020), University of East Anglia Climatic Research Unit. Contains public sector information licensed under the Open Government Licence v3.0. (Open Government Licence v3.0).
Map and trail data © OpenStreetMap contributors
